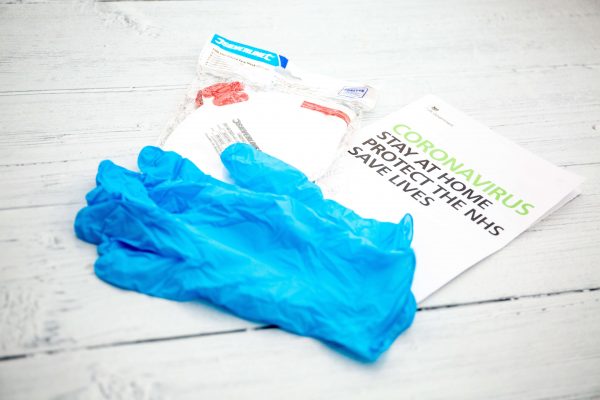
Due to the Corona virus outbreak, many people are being forced to shelter in place with those they live with. This is an issue, because the women who live with abusive partners are now stuck in the house with no other option than to face the abuse. Now more than ever is a time to educate yourself and those around you about domestic violence and violence against women.

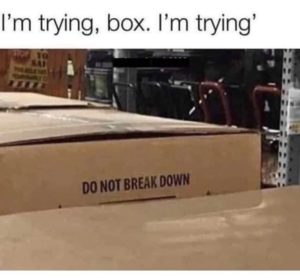
In the last few weeks, calls to the Domestic Violence Hotline and visits to the National Domestic Violence website have shot up astronomically. This increased traffic is a huge call for help. Volunteers in these organizations are doing as much as they can to help, but their numbers are short compared to those of the victims. Not only is this a time period of increased violence, the women being abused are facing even worse mental health conditions. Being forced to stay inside while the world seems to start to end is tough, and with abuse on top of that, life is impossible to live. 

One woman was strangled by her partner, due to his fear that she had caught the corona virus.

I feel like he will lock me out if I leave for work. My husband won’t let me leave the house.

This woman’s case is not rare in times like these. When there is a natural disaster or a pandemic, abuse victims fear for their life.

This increase in violence had been predicted as soon as word of a possible indefinite lockdown got around. Officials knew that anyone in an abusive situation would face horrors that they had yet to learn. But there was little anyone could do to prevent it, and that is still somewhat the case. The longer people continue to go out with their friends and party, the longer helpless women are stuck in these situations. 

Now, some may look at the statistics of crime and notice that it has gone down a bit since quarantine began. Though this is the case, domestic violence is still a crime, and the numbers for that have gone up. By educating people on this topic and spreading awareness, society would become more aware of the detrimental effects of this type of abuse.

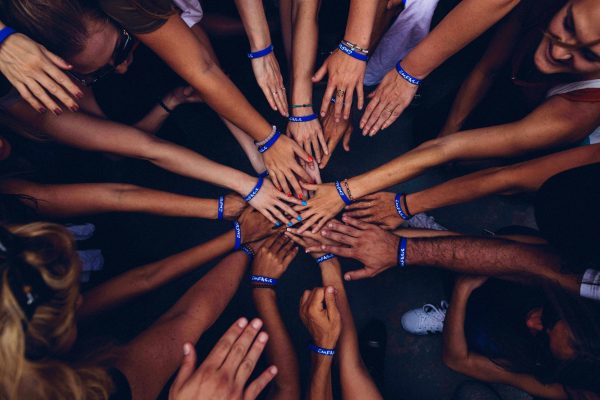
Luckily, for those who may be in need, some people are providing a safe space. Going around Instagram is a post that states something along the lines of: if you are a victim of abuse and are in need of shelter, please contact me. The way Instagram users are safely doing this is by disguising the plea by having the victim send something such as “can i borrow your makeup.” This is a great tactic, because the abuser will not be suspicious and the victim will end up safe. Hidden messages are a great way to help victims, as long as both the victim and the helper are both aware of what the message truly means.

Coronavirus presents a surge in domestic violence


Works cited:

Jagannathan, Meera. “’It’s Not Safe to Leave the House, and It’s Not Safe to Stay in the House.’ How Coronavirus Could Exacerbate Domestic Violence.” MarketWatch, MarketWatch, 5 Apr. 2020, www.marketwatch.com/story/its-not-safe-to-leave-the-house-and-its-not-safe-to-stay-in-the-house-how-coronavirus-could-exacerbate-domestic-violence-2020-03-20.

Post-Traumatic Stress Disorder

PTSD is defined as “a mental health condition that’s triggered by a terrifying event — either experiencing it or witnessing it. Symptoms may include flashbacks, nightmares and severe anxiety, as well as uncontrollable thoughts about the event.” 1 Your nervous system gets stuck in a response associated with a life or death situation. PTSD was first noticed after ww1 when many veterans experience previously mentioned symptoms. Back then it was called shellshock, deriving its name from the shells shot by both sides in trench warfare. However, it was discovered that soldiers who were nowhere near exploding shells experienced symptoms as well.

Soldiers and Mental Health

PTSD is most commonly associated with military veterans. Many times men and women returning from war have a difficult time adjusting to civilian life. Typically veterans have intrusive reminders of the trauma, negative changes to mood and health, extreme avoidance of things associated with trauma, and being on guard or jumpy at all times. Somethings that can help PTSD in soldiers and others, in general, include rhythmic exercising such as running, swimming, rock climbing, and basketball. It helps focus attention on your body, burns of adrenaline, and helps you stay in the moment. Mindful breathing and meditation can help as well with many mental health disorders including PTSD, anxiety, and depression. Sensory input can cause a PSTD trigger, but can also help. Each person is different and can discover which sensory input can help you relax. Connectin with others is also really important to establish support systems and make you feel less isolated.

PTSD Outside of the Military

Despite PTSD mostly being associated with veterans, it can apply to anyone who experienced any kind of trauma. “Today, about 7.7 million American adults have PTSD, according to the Anxiety and Depression Association of America.” 2 This can include people experiencing physical ailments, people who have been through robberies, domestic abuse, rape, children who live in areas with high crime, children who have been through school shootings as so on. I was diagnosed with a mild form of PTSD after getting a concussion that gave me daily headaches for the next six years. It is a lot more common than people think. You might not think something is traumatic, but trauma is relative. It depends on the person and many other numerous factors.

PSTD and Terrorism

“The large body of research conducted after the 9/11 attacks in the past decade suggests that the burden of PTSD among persons with high exposure to 9/11 was substantial” 3 Everyone involved can develop PTSD including victims of the attack, bystanders, and emergency personnel. Different people experience different reactions but “almost everyone who was at the scene of an act of mass violence will have stress reactions in the immediate aftermath. The initial relief to be alive may be followed by distress, fear, survivor guilt or anger.” 4 The increasing number of mass violence attacks are causing distress for many. I know someone who was next to a bomber at the Port Authority bus station. Without knowing he was the bomber, the person I know tried to save him. PTSD and guilt were some of the things he experienced afterward. There are increasing anti-war movements and organizations for peace. The debate over gun laws in America is just one example of how people are trying to stop mass shootings, especially in schools No matter what the solution, the consensus it that mental health after mass violent attacks is a huge issue.

Sources

1 “Post-Traumatic Stress Disorder (PTSD).” Mayo Clinic. Mayo Foundation for Medical Education and Research, July 6, 2018. https://www.mayoclinic.org/diseases-conditions/post-traumatic-stress-disorder/symptoms-causes/syc-20355967.

2 History.com Editors. “PTSD and Shell Shock.” History.com. A&E Television Networks, October 2, 2017. https://www.history.com/topics/inventions/history-of-ptsd-and-shell-shock.

3 Neria, Yuval, Laura DiGrande, and Ben G Adams. “Posttraumatic Stress Disorder Following the September 11, 2001, Terrorist Attacks: a Review of the Literature among Highly Exposed Populations.” The American psychologist. U.S. National Library of Medicine, September 2011. https://www.ncbi.nlm.nih.gov/pmc/articles/PMC3386850/.

4 “VA.gov: Veterans Affairs.” What to Expect in the Wake of Mass Violence, October 6, 2017. https://www.ptsd.va.gov/understand/types/mass_violence_help.asp.

“PTSD in Military Veterans.” HelpGuide.org, February 17, 2020. https://www.helpguide.org/articles/ptsd-trauma/ptsd-in-military-veterans.htm.

Divide and Conquer

Time has proven the effectiveness of the classical divide and conquer strategy and this strategy is no longer limited to just fighting. As a matter of fact, this old strategy is used in a variety of subjects from computer processing to political arguments. Likewise, most projects can be divided into different portions to aid researchers in gauging their progress. Personally, I divided my project into research, writing, scheduling, and technology portions. 

For the most part, writing is going fine, but I have run into a minor researching hindrance. Initially, I planned to write the ‘History of Social Federal Programs in U.S.’ page under the history menu to provide a helpful summary of welfare in the United States based on the facts found in the ‘Cheering for a team no longer on the field: Rhetoric and reality in American welfare history’ scholarly source to make sure that my summary is historically accurate (1). However, as I began to write that page I realized that having another historical source would add depth and accuracy to the page. After some consideration, I decided to find a book on welfare history rather than an article to both satisfy my need for a secondary historical source and fulfill the long scholarly source requirement of the project. When I started to research, I struggled to find a book that matched my needs. This did not surprise me because most of my researching experience was aimed at finding scholarly articles and not longer sources like books. Finally, I used JSTOR Labs Text Analyzer to find Welfare State Institutions and Labor Market Trends (2). Despite focusing on the effects of job loss on economic insecurity, the author dedicates a section to welfare that is aimed to help individuals that lost their jobs in both the United Staes and Germany. Except for the welfare book, all my research is complete and I am incorporating the facts that I found in the scholarly articles and survey to support my reasoning and conclusions.

Another important aspect of the project is scheduling. When defining project management, the scholarly article titled ‘The role of project management in achieving project success’ included the following three attributes, “….planning the execution of the work, monitoring the progress of the work, and adjusting deviations from the plan.”(3) This was done to emphasize the importance of scheduling when it comes to performing a project. Shockingly, designing a simple schedule can sometimes be a challenging task, especially during a time when virtually every course has had to change there work schedule. Despite these hectic times, most of the work is being done on time. 

Lastly, the technological portion of a project is the most general of the four portions since it can include anything from the software being used to present the project to the social media platforms being used for communication between team members. Personally, the main technological challenge that I have faced so far, is navigating the databanks to find scholarly articles, surveys, and books. Normally, I consider research to be half the work of any project partly because of the search algorithms of library websites. In order to find materials addressing a certain subject, I normally end up needing to do five or more different searches with synonymous words to actually find what I am looking for. Moreover, the web filters are not perfect so I sometimes get sources that are not peer-reviewed or sources that I can not have full access to. These technological flaws can get tedious especially when combined with the challenge of analyzing the often wordy sources.

Technology can be helpful…….but programming faults can be annoying. Photo by shutterstock

Footnotes:

1.Levine, Daniel. “Cheering for a Team No Longer on the Field: Rhetoric and Reality in American Welfare History.” Journal of Economic Issues, vol. 35, no. 3, 2001, pp. 733–742., doi:10.1080/00213624.2001.11506398.

2.Ehlert, Martin. “Welfare State Institutions and Labor Market Trends.” In The Impact of Losing Your Job: Unemployment and Influences from Market, Family, and State on Economic Well-Being in the US and Germany, 69-82. Amsterdam: Amsterdam University Press, 2016. Accessed April 8, 2020. doi:10.2307/j.ctt1gsmw6t.6.

3.Munns, AK, and BF Bjeirmi. “The Role of Project Management in Achieving Project Success.” International Journal of Project Management. Pergamon, February 22, 1999. https://www.sciencedirect.com/science/article/abs/pii/0263786395000577.

My project so far is going well but it could be progressing even further. I had to ask for an extension, and on top of that, like everyone said last class, this process is taking much longer than I anticipated. I have about 780 more words to add to my website in order to fulfill my first 2000 word requirement. 

I mainly worked on my “About Me” homepage where I mention that I go to Ramapo College of New Jersey and that I am a participant of the honors program. I added that my Social Science Inquiry class was assigned this research project and that I chose to research on Hispanic immigration. I expanded on why I chose this topic, mentioning that I was adopted and am therefore an immigrant. I also explained why I chose to do Hispanic immigration since I did not immigrate from a Latin American or Hispanic country, but rather from Russia. I mentioned how I was adopted into a Cuban family and that many of my family members are first-generation immigrants and the fact that my parents own a preschool in North Bergen inspired me to narrow my topic down even more to Hispanic Immigration in Hudson County, New Jersey.

I firstly typed all the text I wanted to include in my homepage on a google doc. My homepage was originally going to include an overview of my topic and the information my readers will find throughout my website in addition to the background information about me. When I copy and pasted the text from the google doc into the website page, I realized that the readers are going to be overwhelmed with all the text on that one page and will probably not wind up reading everything I wrote. This prompted me to add an additional page that introduces my website to my readers. It is called “Research Objectives” and provides the expectations and goals I have concerning what I want to get out of the experience of researching about my topic along with what information my readers should expect to find when navigating through my website. 

I additionally customized the website’s theme, changing the boring grey background to one of a blurred picture I took that has purple and pinkish peach tones and that shows light leaks. This makes the website more aesthetically pleasing to the eye. I also matched it with the picture shown at the top of my website’s homepage. I found two pictures, one of a collage of Latin American flags and the other of an American flag, and photoshopped them together. The collage of Latin American flags looks as if it is framed by the American flag. I blurred the Latin American flags slightly and I made everything monochromatic in a violet tone since violet, according to Bojan Lisjak, symbolizes dreams, the future, and spirituality, perfect for the exploration of my topic [1]. I believe this is a powerful edit since my intention for blurring the Latin American flags together, framing it with the American flag, and then making the picture violet is to symbolize unity, equality, and justice. It reveals my voice concerning this controversial debate, but it is also open to interpretation since I tried not to show much bias.  

Latin American flags collage: https://i.pinimg.com/564x/21/17/47/21174714395609e48a2729ee0ec3b02e.jpg American flag image: https://images.homedepot-static.com/productImages/51fad7c8-0351-4d82-a839-2de46c59c440/svn/amscan-seasonal-decorations-120272-64_1000.jpg
This is the image I edited of the two flag photos.

I have not done much research nor looked into the digital tools much since I have been focusing on more of the preliminary steps of talking about myself and my topic. I have not adhered to my schedule and I believe I do have to restructure it since I am behind. For these last 780 words that I have to complete in addition to the 2000 words due next week, I have to shift some of my deadlines so that I do not cram in a load of work last minute. My next step will already be typing out the content for the pages that discuss the political perspectives of Republicans and Democrats as well as gathering information to construct my timelines since those were the first topics I found sources for.

Bibliography:

[1] Lisjak, Bojan. “Violet Color.” About Colors – All About Colors in One Place, www.about-colors.com/violet-color/.


Considering the massive change we all endured recently as a result of world events, this semester is beginning to feel overwhelming in many senses.  It is difficult to get myself to begin on any assignment or project, which never happened to me before.  Once I actually do begin, however, I become productive.  Personally, the writing for my website has been an enjoyable experience.  The research and writing has been successful for the most part, but I definitely enjoy writing my pages more than I enjoy compiling all of my research. Whenever I thought I reached a dead-end in my research, I reconfigured the questions I was asking, and I was able to redirect them to find the desired information I was searching for.

This is a screenshot of the table of contents for the major history source I am using.

I found multiple sources for the history section of my website, my favorite being a pdf about the immigration and ethnicity history in New Jersey (^1).  The text really portrays the history of immigration in New Jersey as being a story, which is one of the main goals of my website.  Within my website, I want readers to feel as though they are also reading a narrative while traveling, whether it be to a new place, a new time, or a new experience.  This source has been significant in describing the “trends” of immigration that I wanted to discuss throughout my website as well as discussing the different types of immigrants who moved to New Jersey, and it has been one of my more useful qualitative sources.  Overall, my research and writing have been going well, as my problems reflect more technological challenges.

For the most part, I am holding to my schedule.  I find it easier to write as I go, although I initially wanted to compile all of my research before writing.  I quickly found that this made my process more difficult.  I restructured my schedule so that I research for certain pages and then do the writing for those pages: I work more efficiently and am able to focus on one issue instead of having my mind going in circles because it is focused on too many matters.

This image depicts different visual forms of quantitative data (Usabilla Blog).

The most useful source for my quantitative data so far has been from Data USA, as stated in my previous blog post for wrangling data (^2).  It has been helpful in providing data having to do with New Jersey’s diversity in both the form of statistics as well as in graphs and charts.

Despite living in an age where technology basically runs everything, I do not consider myself to be tech-savvy whatsoever.  My main challenges are WordPress and Tableau.  For me, WordPress is so complex and so much can be done within it, so it makes the process somewhat daunting because while I want to have informative substance throughout my website, I also want it to be visually appealing (though I do understand that content is arguably more significant than visuals).  Aside from the technicalities of it, it is very simple and straight-forward when it comes to copying my text into it.  On the other hand, every time I use Tableau, I have to relearn the process because I seem to forget one minor step, so that wastes some time.  Considering the obstacles we encountered with the timelines, I will use Sutori instead of Tiki Toki to create my timeline, which I will create as soon as the writing for my history page is finished.  Moving forward as classes begin to mount and come to an end, my biggest advantage will be time management, and my plan is to continue writing in my Google doc and then pasting my text into WordPress as I complete more pages.  I want to add visuals at the end of my writing process so that I maintain focus on all of the information for now.  Despite my minor setbacks along the way, I am learning more about WordPress, and I also learned how to redirect my research to obtain more applicable results. This process is long, but I know it will be rewarding in the end.

______________________________________________

Bibliography

(Image 2) Bodony, Rachel, and Meghan Horvath. “How To Combine Quantitative and Qualitative Data for Better Optimization – The Latest Voice of Customer and CX Trends: Usabilla Blog.” The latest Voice of Customer and CX trends | Usabilla Blog, December 16, 2016.

(^2) “New Jersey.” Data USA. Accessed April 6, 2020.

(Image 1 and ^1) Shaw, Douglas V. Immigration and Ethnicity in New Jersey History. 1994.

Research for my topic is going well. I decided to take a different approach to the project and find information about the topic and put that together before completing the website tab. I want to do this to gather all my information first, place it on a separate doc and then transfer it later. I feel it would help me be better organized with my data. I did also decide to revise my schedule because I have added something new to it. I decided to create the history timeline to show long this has been issue but then I want to focus on racism and discrimination events on college campuses from the last 10 years. But as far as research goes, it’s going well. So far I have found an article on CNN from 2019 about 5 hate crimes being reported on college campuses the week of November 23, 2019. The college campuses that the incidents were reported on were the University of Georgia, Iowa State, Syracuse, University of Wisconsin-Eau Claire, and Auburn University. Each of these universities that were reported has a variety of incidents. For example, at the University of Georgia, there was an incident with a jewish student. The article There have been at least 5 hate incidents reported on college campuses this week states, “At the University of Georgia, student Ariana Dinberg said someone tore off her historically Jewish sorority’s letters from her residence hall door twice in September. At the time, she wasn’t sure it was someone targeting Jews. Later, someone wrote on the white board on her door, “All Heil” with a swastika underneath it. ‘They knew I was Jewish and then chose to attack me for it. It’s definitely shocking to me,’ she said. The University of Georgia confirmed Thursday that someone drew swastikas on placards and message boards at two campus residence halls. It’s unclear who the second victim was.” Or at Syracuse where protests have begun because of a lack of university leadership response because of the racism and discrimination. The article aforementioned above also states, “A spate of racist and anti-Semitic incidents, and what students describe as the university leadership’s slow response to it, have sparked protests on campus. Several cases of prejudiced graffiti have been found on or next to Syracuse’s campus to date. They include racist graffiti that uses language derogatory to African-Americans, a post-it note with anti-Native American language and graffiti with language derogatory to Asians, according to police. In addition, four students have been suspended for participating in a verbal assault directed at an African-American student last week, Chancellor Kent Syverud announced Wednesday.” So far there have not been too many technological challenges. I made a prezi account and have been playing around with the templates. I am thinking of using the prezi to display a number of reported incidents of racism and discrimination within the last 10 years. I want to provide a variety of instances instead of just focusing on a particular kind of repeated incident. 


Karimi, Faith. “There Have Been at Least 5 Hate Incidents Reported on College Campuses This Week.” CNN, Cable News Network, 23 Nov. 2019, www.cnn.com/2019/11/22/us/college-campuses-racist-incidents/index.html.

Creating a full website may seem simple with the ample time a full semester provides you, but truthfully, time flies. For my website on child abuse, my research has okay. I have found a few sites that provide me with good information but I have not been able to get enough information from one source for a whole section. I have found multiple sources for my statistics page that provide me with all different data sets which is very helpful, however, finding coherent information on the history of child abuse is a little harder. I have used various sources and am still fine tuning them to be able to grab the exact points I want my website to show and inform about. So far I have not reached any dead ends, just time-consuming obstacles. I have additionally not had time to find a book source yet and plan to do so within the upcoming week. 

Clipart of a to-do list. This image is relevant to my scheduling and organizing time paragraph

When it came to organizing my time, I was very goal-oriented at the beginning and had set dates. This soon became a slight issue for me. Since being home from school during this pandemic, I have lost my motivation to be honest. I am used to having set study and work spaces, or even a desk, but now I have my bedroom as my family is working in the other rooms of my house. I am working on the project almost everyday, but I do get distracted from everything else going on in my house. I have revised my website schedule to give myself more time on the 2000 word deadlines, and less on making the website look pretty, as I find myself making it look good when I am supposed to be writing. 

I have only worked on my Tableau tool so far on my project. I used the tool to compare the number of reported cases of child abuse in New Jersey to the number of reported cases in the
United States. After playing with Tableau and Google Sheets for a while, I was able to create a pie chart showing the two values. Although I was hoping for more of a statistical chart, I do think the pie chart works. I copied the embed code from the Tableau website into my project but the graphic does not come up properly. I can see the image but it shows a triangle, almost like a “play” button and does not allow me to scroll over the image to see the statistics and number values. Additionally, I have not put too much effort into finding images for my website yet, but I do think a sad image on my homepage would grasp the reader’s attention and make a point that this is a serious social issue. 

Despite minor obstacles and time rescheduling, I think my website is going somewhat smoothly. I have copied some of my writing into the actual WordPress website, but I am still writing more on my google document, which has helped me keep track of my sections and word count.

For my website’s demographics page, I will be including quantitative data regarding the percentage of Hispanic immigrants that reside in four towns in Hudson County, those being North Bergen, West New York, Jersey City, and Union City. One data source I found that has been particularly helpful is the United States Census Bureau. I researched the statistical data of each of the towns’ population ratios. This source has provided me with additional helpful information as well, not just the amount of residents per race, but also per sex. It has various data sets; it also provides information on housing, businesses and employment, families and living arrangements, and population characteristics such as the percentage of how many people are foreign born, which is particularly helpful for my topic of immigration. Moreover, it includes numerical facts on computer and internet use, the level of education, and the health status of the towns, such as the number of people without health insurance and those with disabilities. 

This is a picture of the chart that the US census created to show the racial diversity in Union City in particular.

I find that the statistics on the economy, such as income and poverty, as well as the percentage of employed and unemployed people per town will enhance my demographics section on my website. The data regarding the four Hudson County towns’ financial systems will help me when I conduct further research on the financial social issues of Hispanic immigrants. This can be connected to information that I found under the housing section of this data source concerning the numbers of people who are homeless. I can use the numerical data gathered to create graphs that will organize each town’s dynamics. The data regarding the amount of Hispanics living in each town will benefit me the most since that was the first objective I had in mind when I was researching this data source. I selected these particular branches of data since I want to provide my viewers with thorough background information on the immigrants living in these towns, and I also want to inform them on why I chose these towns out of the pool of towns in Hudson County: these are more known to have attracted Hispanic immigrants throughout history, and I am looking to explore the reason why. I also want to ask my data what relationship do the social problems of poverty and other economic issues share with the number of Hispanics living in each town? I also noticed that this data source included some demographic topics but not others, such as transportation, but not religion, but that is a question that does not really relate to my research topic. 

This is also from the US census, and it is a map of New Jersey that allows you to scroll over and see the names of various towns. I would like my map tool to look like this, allowing visitors of my website to scroll over and read various statistics.

I do not find the data hard to work with and I believe it is helpful and easy to use for when I plug data into my map tool. I will include percentages in the caption and perhaps I will make an additional Tableau data visualization to organize the numbers more clearly, even though my original plan was that I would create a Tableau data visualization to discuss which regions of New Jersey are more populated with Republicans and which are more populated with Democrats. I would have to massage and clean up the data a little since it includes the amount of foreign-born inhabitants, but not where it calculates the level of racial diversity. I would have to find other reliable data sources that break this question down even more, dividing the number of Hispanics between immigrants and natives. It would be an issue to include only the number of Hispanics per town since I am primarily looking for the number of Hispanic immigrants per town. I feel somewhat confident but I also have my doubts that I will not be able to calculate the numbers properly. This doubt prompts me to find more data sources to compare it with this census to clarify the questions I have regarding the percentages. 

Links to the census per town:

https://www.census.gov/quickfacts/northbergentownshiphudsoncountynewjersey

https://www.census.gov/quickfacts/westnewyorktownnewjersey

https://www.census.gov/quickfacts/unioncitycitynewjersey

https://www.census.gov/quickfacts/fact/table/jerseycitycitynewjersey,US/PST045219

The topic of child abuse has been a social issue for almost all of time. Finding research on this issue can be somewhat tricky. When child abuse became more of a prevalent issue in history, many newspapers reported the issue and how towns and states would handle the situations. Eventually, and over time, child abuse began to receive a negative connotation and the issue became hidden and less talked about publicly. For my research, with the help of my lovely professor, I was able to find research and statistics about child abuse and child abuse cases in new Jersey.  

Using data from the New Jersey Department of Children and Families allowed me to gain quantitative results about child abuse. The Child Abuse and Neglect in New Jersey Statistical Report shows data for the year 2004 in New Jersey. This file provides a clearly defined definition of child abuse as well as detailed statistics. With this data in particular, I am able to find the number of abuse and neglect referrals received by DYFS, which counties reported the most or least cases of child abuse per year, and where the highest number of allegations or referrals came from- school staff. This pdf file allows me to use its statistical data to fulfill my website, as well as compare the statistics of New Jersey to the statistics of the United States. The one concern I have with this file of information is that it is from 2004, approximately 16 years old. Times are constantly changing in regards to social issues and while I can use this data, I can also compare it to data from more recent years to see how child abuse has either increased or decreased over the years. 

Additionally being found from nj.gov, the file Supporting Strong Families and Communities in New Jersey: Preventing Child Abuse and Neglect, 2014-2017 provides valuable information about child abuse. Initially, I can use this source for information about risk factors, protective factors, as well as more statistics. There is a particular chart, Figure 1, that shows the breakup of types of child abuse and neglect in 2012. Again while this data is a little out-dated, it is a good reference for basic information on the topic. 

One of my other sources for statistical data is the New Jersey Department of Children and Families’ Commissioner’s Monthly Report for March 2020. This Data is up to date and relevant. It shows statistics for children in out-of-home placement, number of referrals compared to past years, response times to the reports, how often workers visit the children, and medical statistics for children who are victims or have ongoing and pending cases. This information will help the statistics aspect of my website a lot. 

These three sources will help me analyze my topic over time, specifically the past 16 years. They also provide very clear data that is easy to work with. This data can also be typed into a google sheets file and put into Tableau. I can use this to show the ratio of number of cases in New Jersey to the number of cases in the USA.


“DCF: Commissioner’s Monthly Reports.” DCF | Commissioner’s Monthly Reports, www.nj.gov/dcf/childdata/continuous/.

“DCF: Families.” DCF | Families, www.nj.gov/dcf/families/.


How it’s Going

For my project, I have been able to find a lot more research than I anticipated. That being said I am also running into plenty of difficulties. The databases I have used like ProQuest that perfectly fit what I need are almost always out of date, so I have to use it for historical aspects. I have been using a good amount of reliable internet sources like human rights campaign, glaad, gallup poll, and isidewith. I ran into multiple dead ends with researching databases until the discovery of Jstor text analyzer and Ramapo’s potter library online book search. I found one book that gives a vast history of LGBTQ+ evens all over the world involving all sorts of people. I finally found information about the Vietnam war and LGBTQ+ in the military during that time. On Jstor, I found information about DADT and actual accounts of how that affects non-LGBTQ+ and LGBTQ+ members. I also found information about gay church movements. My next step is talking about the Lavender scare and that was made extremely easy by a Jstor article I found. I am having trouble remembering what source said what though due to the massive amount of information I need that is spread out through many books and articles.

Sticking to Schedule

I am trying to stick to my schedule, but actually putting the information into my website it takes a longer time than I anticipated. I have been trying to trim down my website to make it easier, but it is difficult to choose what to exclude. For example, I cut down the history two to tabs, removed the people tab, removed the tab about military opinions, and so on. Now I have limited the research I have done on that and have now incorporated it into another tab. I have been able to finish the about me tab, the general information tab, half of the history tab, and two-thirds of the public opinion tab. I have to finish the solutions tab, the change and why tab, and the personal accounts tab. I hope to finish the public opinion and history tab this week and move on to the next tab, personal accounts. I hope each tab will take me a week to do.

Technology is NOT my Friend

Some technological challenges I have faced are me at a computer. I am awful with technology and have been struggling to navigate everything. I have finally gotten used to WordPress and do not mind using it. Tikitok looks nice but was difficult to use. I also figured out that you cannot embed the timeline on a website without paying, which is awful. I have also tried to include infographics but cannot seem to figure out how to use canva and other such online resources. My go-to is adding pictures and citing them or looking for an image labeled for reuse.

Overall

Overall the project is going well. It is going to be hard work, but I am hoping that in the end, it will all work out. I am glad I chose the topic I did because I am learning about something I am passionate about. I am also learning valuable skills that will help me as a history major, such as what and where to research, how to create a website about a historical topic and so on. (more…)

css.php