Blog Post #10: Project Report
Considering the massive change we all endured recently as a result of world events, this semester is beginning to feel overwhelming in many senses. It is difficult to get myself to begin on any assignment or project, which never happened to me before. Once I actually do begin, however, I become productive. Personally, the writing for my website has been an enjoyable experience. The research and writing has been successful for the most part, but I definitely enjoy writing my pages more than I enjoy compiling all of my research. Whenever I thought I reached a dead-end in my research, I reconfigured the questions I was asking, and I was able to redirect them to find the desired information I was searching for.
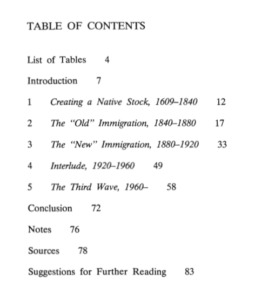
I found multiple sources for the history section of my website, my favorite being a pdf about the immigration and ethnicity history in New Jersey (^1). The text really portrays the history of immigration in New Jersey as being a story, which is one of the main goals of my website. Within my website, I want readers to feel as though they are also reading a narrative while traveling, whether it be to a new place, a new time, or a new experience. This source has been significant in describing the “trends” of immigration that I wanted to discuss throughout my website as well as discussing the different types of immigrants who moved to New Jersey, and it has been one of my more useful qualitative sources. Overall, my research and writing have been going well, as my problems reflect more technological challenges.
For the most part, I am holding to my schedule. I find it easier to write as I go, although I initially wanted to compile all of my research before writing. I quickly found that this made my process more difficult. I restructured my schedule so that I research for certain pages and then do the writing for those pages: I work more efficiently and am able to focus on one issue instead of having my mind going in circles because it is focused on too many matters.

The most useful source for my quantitative data so far has been from Data USA, as stated in my previous blog post for wrangling data (^2). It has been helpful in providing data having to do with New Jersey’s diversity in both the form of statistics as well as in graphs and charts.
Despite living in an age where technology basically runs everything, I do not consider myself to be tech-savvy whatsoever. My main challenges are WordPress and Tableau. For me, WordPress is so complex and so much can be done within it, so it makes the process somewhat daunting because while I want to have informative substance throughout my website, I also want it to be visually appealing (though I do understand that content is arguably more significant than visuals). Aside from the technicalities of it, it is very simple and straight-forward when it comes to copying my text into it. On the other hand, every time I use Tableau, I have to relearn the process because I seem to forget one minor step, so that wastes some time. Considering the obstacles we encountered with the timelines, I will use Sutori instead of Tiki Toki to create my timeline, which I will create as soon as the writing for my history page is finished. Moving forward as classes begin to mount and come to an end, my biggest advantage will be time management, and my plan is to continue writing in my Google doc and then pasting my text into WordPress as I complete more pages. I want to add visuals at the end of my writing process so that I maintain focus on all of the information for now. Despite my minor setbacks along the way, I am learning more about WordPress, and I also learned how to redirect my research to obtain more applicable results. This process is long, but I know it will be rewarding in the end.
______________________________________________
Bibliography
(Image 2) Bodony, Rachel, and Meghan Horvath. “How To Combine Quantitative and Qualitative Data for Better Optimization – The Latest Voice of Customer and CX Trends: Usabilla Blog.” The latest Voice of Customer and CX trends | Usabilla Blog, December 16, 2016.
(^2) “New Jersey.” Data USA. Accessed April 6, 2020.
(Image 1 and ^1) Shaw, Douglas V. Immigration and Ethnicity in New Jersey History. 1994.