Blog Post #9: Wrangling Data
For my website’s demographics page, I will be including quantitative data regarding the percentage of Hispanic immigrants that reside in four towns in Hudson County, those being North Bergen, West New York, Jersey City, and Union City. One data source I found that has been particularly helpful is the United States Census Bureau. I researched the statistical data of each of the towns’ population ratios. This source has provided me with additional helpful information as well, not just the amount of residents per race, but also per sex. It has various data sets; it also provides information on housing, businesses and employment, families and living arrangements, and population characteristics such as the percentage of how many people are foreign born, which is particularly helpful for my topic of immigration. Moreover, it includes numerical facts on computer and internet use, the level of education, and the health status of the towns, such as the number of people without health insurance and those with disabilities.
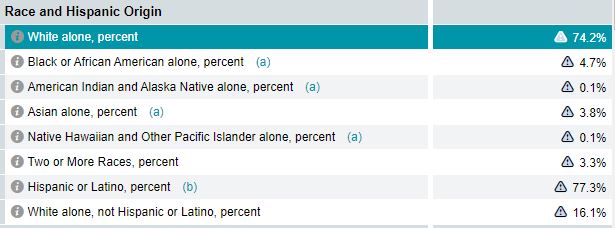
I find that the statistics on the economy, such as income and poverty, as well as the percentage of employed and unemployed people per town will enhance my demographics section on my website. The data regarding the four Hudson County towns’ financial systems will help me when I conduct further research on the financial social issues of Hispanic immigrants. This can be connected to information that I found under the housing section of this data source concerning the numbers of people who are homeless. I can use the numerical data gathered to create graphs that will organize each town’s dynamics. The data regarding the amount of Hispanics living in each town will benefit me the most since that was the first objective I had in mind when I was researching this data source. I selected these particular branches of data since I want to provide my viewers with thorough background information on the immigrants living in these towns, and I also want to inform them on why I chose these towns out of the pool of towns in Hudson County: these are more known to have attracted Hispanic immigrants throughout history, and I am looking to explore the reason why. I also want to ask my data what relationship do the social problems of poverty and other economic issues share with the number of Hispanics living in each town? I also noticed that this data source included some demographic topics but not others, such as transportation, but not religion, but that is a question that does not really relate to my research topic.
![]()
![]()
![]()
![]()
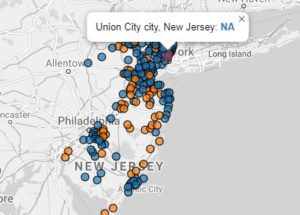
I do not find the data hard to work with and I believe it is helpful and easy to use for when I plug data into my map tool. I will include percentages in the caption and perhaps I will make an additional Tableau data visualization to organize the numbers more clearly, even though my original plan was that I would create a Tableau data visualization to discuss which regions of New Jersey are more populated with Republicans and which are more populated with Democrats. I would have to massage and clean up the data a little since it includes the amount of foreign-born inhabitants, but not where it calculates the level of racial diversity. I would have to find other reliable data sources that break this question down even more, dividing the number of Hispanics between immigrants and natives. It would be an issue to include only the number of Hispanics per town since I am primarily looking for the number of Hispanic immigrants per town. I feel somewhat confident but I also have my doubts that I will not be able to calculate the numbers properly. This doubt prompts me to find more data sources to compare it with this census to clarify the questions I have regarding the percentages.
Links to the census per town:
https://www.census.gov/quickfacts/northbergentownshiphudsoncountynewjersey
https://www.census.gov/quickfacts/westnewyorktownnewjersey
https://www.census.gov/quickfacts/unioncitycitynewjersey
https://www.census.gov/quickfacts/fact/table/jerseycitycitynewjersey,US/PST045219