A Savory Dish of Data
When served a savory dish, it can be easy to forget the time and effort required to prepare the dish that will only last 10-20 minutes. Similarly, it is easy to forget about the effort put in by statistical analysts to prepare a helpful infographic or statistical table that is only admired by its viewers for a minute or two. Behind every colorful graph, a team of people worked tirelessly to interview thousands of individuals as a reliable population or accurately perform delicate experiments. Moreover, the raw data they collect then needs to be cleaned, processed, stored, interpreted, and then finally laid out as an attractive chart. This tedious process is called data processing, which was summarized by Talend, “as starting with data in its raw form and converting it into a more readable format (graphs, documents, etc.), giving it the form and context necessary to be interpreted…”(1). In other words, making a reliable graph requires data collection and then data processing.
In order to obtain reliable data, researchers can conduct their own study or they can find the data from a trustworthy company or peer group that has already performed the study. Personally, I used the George T. Potter Library and Proquest Medline to acquire my statistics. At first, I found a survey called “AMERICANS’ VALUES AND BELIEFS ABOUT NATIONAL HEALTH INSURANCE REFORM.” that was conducted by the SSRS, an independent research company, for The Commonwealth Fund, The New York Times, and Harvard T.H. Chan School of Public Health (2). To clarify, the survey focuses on how an individual’s standpoint on the medicare problem correlated with their view of various other subjects. After further research, I was surprised to find that most of the scholarly sources I acquired came with links to data on which the articles were based. However, I ultimately decided to use the first survey I found for several reasons. Not only does the AMERICANS’ VALUES survey provide clean data that is ready to be graphed, but it also provides a wide variety of data sets that correlate individuals’ standpoints on the medicare problem with their view of various other subjects. In other words, the data provided by the survey is both clear and flexible since the data connects to different subjects. This flexibility can allow me to use the data to answer a variety of questions and fit data graphics into various areas of the website. For instance, the most straightforward question I can ask the data is which percentage of Americans support single-payer healthcare, but this question would only scratch the surface. Another question I could ask is how approval of government-run federal programs correlates with preferred medical plans, which can be an important graph for the “other social programs” page of the website where I will theorize that the success of other social programs in the U.S. reflects positively on single-Payer healthcare. The only downside of this survey is that it was conducted only by phone which limits the type of people that could take the survey. On the other hand, using the data sources provided by the scholarly articles seemed like an unnecessary risk since I had no way of knowing how clean, relevant, or flexible the data sources are. In essence, I decided to use the survey because of its advantages and because of the risks associated with using the data sources provided by the scholarly articles.
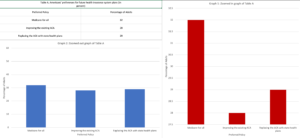
Despite the effort that goes into data collection and then data processing, the final step of data processing, the visualization of data, is the most important. Not only is the visualized data the final product of the whole tiring process, but according to Govex the visualized data is also meant “to influence the decision of your viewers…and direct their attention to the relevant parts of your visual”(3). In other words, the visual is supposed to convey a message to the viewer and the visual should make the data that conveys that message clear. For instance, the image below displays Table A from the survey graphed using two deferent methods. By changing the scale of the bar charts the same data can appear vastly different. In graph 1 the difference in percentages is clear but in graph 2 the difference in the percentages looks negatable. To conclude, it is important to consider the impact of the visualized data on the viewers and how different methods of visualization can change this impact.
Footnotes:
- Pearlman, Shana. “What Is Data Processing? Definition and Stages – Talend Cloud Integration.” Talend Real-Time Open Source Data Integration Software. Accessed April 1, 2020. https://www.talend.com/resources/what-is-data-processing/.
- “AMERICANS’ VALUES AND BELIEFS ABOUT NATIONAL HEALTH INSURANCE REFORM.” The Commonwealth Fund, The New York Times, and Harvard T.H. Chan School of Public Health by SSRS, October 2019. https://cdn1.sph.harvard.edu/wp-content/uploads/sites/94/2019/10/CMWF-NYT-Harvard_Final-Report_Oct2019.pdf.
- Benison, Michael, and Michael Benison. “6 Ways Your Data Visualizations Can Influence Decisions.” Johns Hopkins Center for Government Excellence. Accessed April 1, 2020. https://govex.jhu.edu/wiki/influencing-decisions-with-data-visualizations/.
You May Like
Thinking about Social Issues
Sweatshop Experiences

The Importance of Mental Health Advocacy



 The library at Ramapo offers many databases to use, such as, JSTOR, ProQuest, and Academic Search Premier and those are just a few databases. That’s not mentioning the other sources provided by the professor such as the Jane Addams Digital Edition, which holds newspapers and historical information for a variety of topics. But I usually just stick to using Ramapo College databases because they have everything I need. They have full text pdf, scholarly journals and sources, and they have the source already cited. I don’t ever have to worry about the credibility of the source I want to use because I know it’s credible. But questions I plan to ask my data are, how long has racism and discrimination been an issue on college campuses, how does racism and discrimination affect that colleges attendance rate and what is being done to combat this issue on campus. Finding data for some of these questions will not be easy at all. Proper wording of the question or the correct keys used will be important when finding data. I believe the most difficult question to find data for is how would racism and discrimination affect college attendance rates. This would be most difficult in my opinion because that kind of data is hard to attain. For that data to have any kind of statistical truth, people would have to confess to that being a reason why they make the choice to not attend a college. Not too many people would do that because not a lot of people like admitting that they are scared. So I believe a little cleaning would be needed for that question and data to be used.
 The process of analyzing and visualizing data can be difficult if you have no idea what you are doing. If you do not have the correct information to answer the question then the data you have would mean nothing. But the questions I plan to ask will cover a range of fields for me. I plan to ask questions that will give the history of the issue, that will tell me how the people feel about the issue, and will inform me of what is done to stop the issue.