Wrangling Data: Immigration Sources
Initially, I wanted to focus my website project on immigration and its influence on economic disparities within the state of New Jersey. I quickly found that finding sources that showed both the relation and correlation between immigration and economic disparities were not common and often separated the two categories from one another instead of in a more comparative manner. I looked on sites such as JSTOR and ProQuest for my qualitative data, while I turned to sources such as the Bureau of Economic Analysis for my quantitative data. Since I could not find data supporting the linking of my social issue, I reconfigured my topic to focus on immigration within New Jersey.
The whole process of finding a data source that is useful for my website project involved first looking at sources found on JSTOR and ProQuest. Here, I was able to locate plenty of argumentative pieces that either advocated or rejected the ideas of immigration benefitting society as a whole. These engines gave me choices from several sets of data and offered a wide range of perspectives, which is useful in the overarching goal of my website: to allow individuals to formulate their opinions based on unbiased data presented to them. For more statistical and quantitative data, I plan to continue to use https://datausa.io. This site provides New Jersey data having to do with the economy, diversity, education, and housing and living. My selection of sources is indicative of my main goal of wanting to provide a range of perspectives so that individuals can think freely and draw their own conclusions using the data provided throughout my website. I did not want to focus so much on immigration benefits or drawbacks, but I wanted to focus more so of the role immigration plays in New Jersey as well as its effects within the economy, demographics, education, and diversity. Creating a well-rounded website with a balanced focus on aspects of immigration will provide readers with backgrounds of more knowledge. Some questions I want to ask my data include:
- How does immigration impact the economy?
- What is the history of immigration, and where do we see immigrant groups moving?
- Which populations of New Jersey face the most poverty?
- What populations/demographics are largest within New Jersey?
- Where do populations of immigrants usually move/congregate?
- What roles has immigration and diversity played on culture and lifestyle?
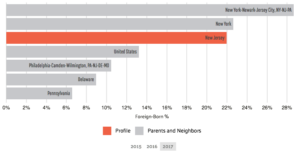
Immigration is a vast topic that can be dealt with using social sciences or more pragmatic methods such as economic factors, so a majority of fields would be able to answer these questions, including economics, business, education, humanities, and other social sciences. Immigration affects more people than we realize. As of 2017, 22% of New Jersey residents were born outside of the United States (^1). Compared to my last topic, the data used for immigration in New Jersey is much easier to handle and break down seeing that I can extrapolate information having to do with different fields instead of focusing solely on the economics and disparities associated with immigrants. However, sources indicated that economic concerns dominate the worries of Americans due to the labor market and revenue (^2). Data supports the notion that economics plays a large role in the perception of immigration.

Most data usually requires cleaning or massaging to some degree in order to obtain the desired information, oftentimes because sources provide more data than is actually necessary. I find that surveys are skewed at times because they depend on the honesty of respondents, and they may not answer every question completely truthfully, so data sources such as polls and surveys should be used with caution, as discussed in previous lectures. Considering this, I will have to adjust it so that it provides readers insight to the topic from the general public’s perspective. I do not foresee any problems with obtaining the necessary data, but one concerning issue is that recent data may be skewed as a reflection of the ongoing immigration debate throughout recent years. Overall, the process of analyzing and visualizing data go together: after analyzing data, it is helpful to see its meaning and significance in the form of charts or graphs. It is easier for many to see effects versus reading about them. It assists individuals in trying to comprehend data’s meaning and apply it to any given issue, and the process proves effective when wanting to draw conclusions of issues.
______________________________________________
Bibliography
(Image 2) Damicis, Jim, and Bethany Meys. “Immigrants Are Critical to the Economy.” Immigrants are Critical to the Economy | Camoin Associates, June 11, 2018. https://www.camoinassociates.com/immigrants-are-critical-economy.
(^2) Espenshade, Thomas J., and Vanessa E. King. “State and Local Fiscal Impacts of US Immigrants: Evidence from New Jersey.” Population Research and Policy Review 13, no. 3 (1994): 225-56. Accessed March 30, 2020. www.jstor.org/stable/40229734.
(Image 1 and ^1) “New Jersey.” Data USA. Accessed March 30, 2020. https://datausa.io/profile/geo/new-jersey#demographics.