Day: April 8, 2020

Divide and Conquer

Time has proven the effectiveness of the classical divide and conquer strategy and this strategy is no longer limited to just fighting. As a matter of fact, this old strategy is used in a variety of subjects from computer processing to political arguments. Likewise, most projects can be divided into different portions to aid researchers in gauging their progress. Personally, I divided my project into research, writing, scheduling, and technology portions. 

For the most part, writing is going fine, but I have run into a minor researching hindrance. Initially, I planned to write the ‘History of Social Federal Programs in U.S.’ page under the history menu to provide a helpful summary of welfare in the United States based on the facts found in the ‘Cheering for a team no longer on the field: Rhetoric and reality in American welfare history’ scholarly source to make sure that my summary is historically accurate (1). However, as I began to write that page I realized that having another historical source would add depth and accuracy to the page. After some consideration, I decided to find a book on welfare history rather than an article to both satisfy my need for a secondary historical source and fulfill the long scholarly source requirement of the project. When I started to research, I struggled to find a book that matched my needs. This did not surprise me because most of my researching experience was aimed at finding scholarly articles and not longer sources like books. Finally, I used JSTOR Labs Text Analyzer to find Welfare State Institutions and Labor Market Trends (2). Despite focusing on the effects of job loss on economic insecurity, the author dedicates a section to welfare that is aimed to help individuals that lost their jobs in both the United Staes and Germany. Except for the welfare book, all my research is complete and I am incorporating the facts that I found in the scholarly articles and survey to support my reasoning and conclusions.

Another important aspect of the project is scheduling. When defining project management, the scholarly article titled ‘The role of project management in achieving project success’ included the following three attributes, “….planning the execution of the work, monitoring the progress of the work, and adjusting deviations from the plan.”(3) This was done to emphasize the importance of scheduling when it comes to performing a project. Shockingly, designing a simple schedule can sometimes be a challenging task, especially during a time when virtually every course has had to change there work schedule. Despite these hectic times, most of the work is being done on time. 

Lastly, the technological portion of a project is the most general of the four portions since it can include anything from the software being used to present the project to the social media platforms being used for communication between team members. Personally, the main technological challenge that I have faced so far, is navigating the databanks to find scholarly articles, surveys, and books. Normally, I consider research to be half the work of any project partly because of the search algorithms of library websites. In order to find materials addressing a certain subject, I normally end up needing to do five or more different searches with synonymous words to actually find what I am looking for. Moreover, the web filters are not perfect so I sometimes get sources that are not peer-reviewed or sources that I can not have full access to. These technological flaws can get tedious especially when combined with the challenge of analyzing the often wordy sources.

Technology can be helpful…….but programming faults can be annoying. Photo by shutterstock

Footnotes:

1.Levine, Daniel. “Cheering for a Team No Longer on the Field: Rhetoric and Reality in American Welfare History.” Journal of Economic Issues, vol. 35, no. 3, 2001, pp. 733–742., doi:10.1080/00213624.2001.11506398.

2.Ehlert, Martin. “Welfare State Institutions and Labor Market Trends.” In The Impact of Losing Your Job: Unemployment and Influences from Market, Family, and State on Economic Well-Being in the US and Germany, 69-82. Amsterdam: Amsterdam University Press, 2016. Accessed April 8, 2020. doi:10.2307/j.ctt1gsmw6t.6.

3.Munns, AK, and BF Bjeirmi. “The Role of Project Management in Achieving Project Success.” International Journal of Project Management. Pergamon, February 22, 1999. https://www.sciencedirect.com/science/article/abs/pii/0263786395000577.

My project so far is going well but it could be progressing even further. I had to ask for an extension, and on top of that, like everyone said last class, this process is taking much longer than I anticipated. I have about 780 more words to add to my website in order to fulfill my first 2000 word requirement. 

I mainly worked on my “About Me” homepage where I mention that I go to Ramapo College of New Jersey and that I am a participant of the honors program. I added that my Social Science Inquiry class was assigned this research project and that I chose to research on Hispanic immigration. I expanded on why I chose this topic, mentioning that I was adopted and am therefore an immigrant. I also explained why I chose to do Hispanic immigration since I did not immigrate from a Latin American or Hispanic country, but rather from Russia. I mentioned how I was adopted into a Cuban family and that many of my family members are first-generation immigrants and the fact that my parents own a preschool in North Bergen inspired me to narrow my topic down even more to Hispanic Immigration in Hudson County, New Jersey.

I firstly typed all the text I wanted to include in my homepage on a google doc. My homepage was originally going to include an overview of my topic and the information my readers will find throughout my website in addition to the background information about me. When I copy and pasted the text from the google doc into the website page, I realized that the readers are going to be overwhelmed with all the text on that one page and will probably not wind up reading everything I wrote. This prompted me to add an additional page that introduces my website to my readers. It is called “Research Objectives” and provides the expectations and goals I have concerning what I want to get out of the experience of researching about my topic along with what information my readers should expect to find when navigating through my website. 

I additionally customized the website’s theme, changing the boring grey background to one of a blurred picture I took that has purple and pinkish peach tones and that shows light leaks. This makes the website more aesthetically pleasing to the eye. I also matched it with the picture shown at the top of my website’s homepage. I found two pictures, one of a collage of Latin American flags and the other of an American flag, and photoshopped them together. The collage of Latin American flags looks as if it is framed by the American flag. I blurred the Latin American flags slightly and I made everything monochromatic in a violet tone since violet, according to Bojan Lisjak, symbolizes dreams, the future, and spirituality, perfect for the exploration of my topic [1]. I believe this is a powerful edit since my intention for blurring the Latin American flags together, framing it with the American flag, and then making the picture violet is to symbolize unity, equality, and justice. It reveals my voice concerning this controversial debate, but it is also open to interpretation since I tried not to show much bias.  

Latin American flags collage: https://i.pinimg.com/564x/21/17/47/21174714395609e48a2729ee0ec3b02e.jpg American flag image: https://images.homedepot-static.com/productImages/51fad7c8-0351-4d82-a839-2de46c59c440/svn/amscan-seasonal-decorations-120272-64_1000.jpg
This is the image I edited of the two flag photos.

I have not done much research nor looked into the digital tools much since I have been focusing on more of the preliminary steps of talking about myself and my topic. I have not adhered to my schedule and I believe I do have to restructure it since I am behind. For these last 780 words that I have to complete in addition to the 2000 words due next week, I have to shift some of my deadlines so that I do not cram in a load of work last minute. My next step will already be typing out the content for the pages that discuss the political perspectives of Republicans and Democrats as well as gathering information to construct my timelines since those were the first topics I found sources for.

Bibliography:

[1] Lisjak, Bojan. “Violet Color.” About Colors – All About Colors in One Place, www.about-colors.com/violet-color/.


Considering the massive change we all endured recently as a result of world events, this semester is beginning to feel overwhelming in many senses.  It is difficult to get myself to begin on any assignment or project, which never happened to me before.  Once I actually do begin, however, I become productive.  Personally, the writing for my website has been an enjoyable experience.  The research and writing has been successful for the most part, but I definitely enjoy writing my pages more than I enjoy compiling all of my research. Whenever I thought I reached a dead-end in my research, I reconfigured the questions I was asking, and I was able to redirect them to find the desired information I was searching for.

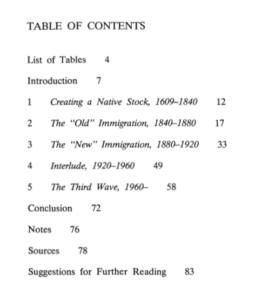
This is a screenshot of the table of contents for the major history source I am using.

I found multiple sources for the history section of my website, my favorite being a pdf about the immigration and ethnicity history in New Jersey (^1).  The text really portrays the history of immigration in New Jersey as being a story, which is one of the main goals of my website.  Within my website, I want readers to feel as though they are also reading a narrative while traveling, whether it be to a new place, a new time, or a new experience.  This source has been significant in describing the “trends” of immigration that I wanted to discuss throughout my website as well as discussing the different types of immigrants who moved to New Jersey, and it has been one of my more useful qualitative sources.  Overall, my research and writing have been going well, as my problems reflect more technological challenges.

For the most part, I am holding to my schedule.  I find it easier to write as I go, although I initially wanted to compile all of my research before writing.  I quickly found that this made my process more difficult.  I restructured my schedule so that I research for certain pages and then do the writing for those pages: I work more efficiently and am able to focus on one issue instead of having my mind going in circles because it is focused on too many matters.

This image depicts different visual forms of quantitative data (Usabilla Blog).

The most useful source for my quantitative data so far has been from Data USA, as stated in my previous blog post for wrangling data (^2).  It has been helpful in providing data having to do with New Jersey’s diversity in both the form of statistics as well as in graphs and charts.

Despite living in an age where technology basically runs everything, I do not consider myself to be tech-savvy whatsoever.  My main challenges are WordPress and Tableau.  For me, WordPress is so complex and so much can be done within it, so it makes the process somewhat daunting because while I want to have informative substance throughout my website, I also want it to be visually appealing (though I do understand that content is arguably more significant than visuals).  Aside from the technicalities of it, it is very simple and straight-forward when it comes to copying my text into it.  On the other hand, every time I use Tableau, I have to relearn the process because I seem to forget one minor step, so that wastes some time.  Considering the obstacles we encountered with the timelines, I will use Sutori instead of Tiki Toki to create my timeline, which I will create as soon as the writing for my history page is finished.  Moving forward as classes begin to mount and come to an end, my biggest advantage will be time management, and my plan is to continue writing in my Google doc and then pasting my text into WordPress as I complete more pages.  I want to add visuals at the end of my writing process so that I maintain focus on all of the information for now.  Despite my minor setbacks along the way, I am learning more about WordPress, and I also learned how to redirect my research to obtain more applicable results. This process is long, but I know it will be rewarding in the end.

______________________________________________

Bibliography

(Image 2) Bodony, Rachel, and Meghan Horvath. “How To Combine Quantitative and Qualitative Data for Better Optimization – The Latest Voice of Customer and CX Trends: Usabilla Blog.” The latest Voice of Customer and CX trends | Usabilla Blog, December 16, 2016.

(^2) “New Jersey.” Data USA. Accessed April 6, 2020.

(Image 1 and ^1) Shaw, Douglas V. Immigration and Ethnicity in New Jersey History. 1994.

Research for my topic is going well. I decided to take a different approach to the project and find information about the topic and put that together before completing the website tab. I want to do this to gather all my information first, place it on a separate doc and then transfer it later. I feel it would help me be better organized with my data. I did also decide to revise my schedule because I have added something new to it. I decided to create the history timeline to show long this has been issue but then I want to focus on racism and discrimination events on college campuses from the last 10 years. But as far as research goes, it’s going well. So far I have found an article on CNN from 2019 about 5 hate crimes being reported on college campuses the week of November 23, 2019. The college campuses that the incidents were reported on were the University of Georgia, Iowa State, Syracuse, University of Wisconsin-Eau Claire, and Auburn University. Each of these universities that were reported has a variety of incidents. For example, at the University of Georgia, there was an incident with a jewish student. The article There have been at least 5 hate incidents reported on college campuses this week states, “At the University of Georgia, student Ariana Dinberg said someone tore off her historically Jewish sorority’s letters from her residence hall door twice in September. At the time, she wasn’t sure it was someone targeting Jews. Later, someone wrote on the white board on her door, “All Heil” with a swastika underneath it. ‘They knew I was Jewish and then chose to attack me for it. It’s definitely shocking to me,’ she said. The University of Georgia confirmed Thursday that someone drew swastikas on placards and message boards at two campus residence halls. It’s unclear who the second victim was.” Or at Syracuse where protests have begun because of a lack of university leadership response because of the racism and discrimination. The article aforementioned above also states, “A spate of racist and anti-Semitic incidents, and what students describe as the university leadership’s slow response to it, have sparked protests on campus. Several cases of prejudiced graffiti have been found on or next to Syracuse’s campus to date. They include racist graffiti that uses language derogatory to African-Americans, a post-it note with anti-Native American language and graffiti with language derogatory to Asians, according to police. In addition, four students have been suspended for participating in a verbal assault directed at an African-American student last week, Chancellor Kent Syverud announced Wednesday.” So far there have not been too many technological challenges. I made a prezi account and have been playing around with the templates. I am thinking of using the prezi to display a number of reported incidents of racism and discrimination within the last 10 years. I want to provide a variety of instances instead of just focusing on a particular kind of repeated incident. 


Karimi, Faith. “There Have Been at Least 5 Hate Incidents Reported on College Campuses This Week.” CNN, Cable News Network, 23 Nov. 2019, www.cnn.com/2019/11/22/us/college-campuses-racist-incidents/index.html.

Creating a full website may seem simple with the ample time a full semester provides you, but truthfully, time flies. For my website on child abuse, my research has okay. I have found a few sites that provide me with good information but I have not been able to get enough information from one source for a whole section. I have found multiple sources for my statistics page that provide me with all different data sets which is very helpful, however, finding coherent information on the history of child abuse is a little harder. I have used various sources and am still fine tuning them to be able to grab the exact points I want my website to show and inform about. So far I have not reached any dead ends, just time-consuming obstacles. I have additionally not had time to find a book source yet and plan to do so within the upcoming week. 

Clipart of a to-do list. This image is relevant to my scheduling and organizing time paragraph

When it came to organizing my time, I was very goal-oriented at the beginning and had set dates. This soon became a slight issue for me. Since being home from school during this pandemic, I have lost my motivation to be honest. I am used to having set study and work spaces, or even a desk, but now I have my bedroom as my family is working in the other rooms of my house. I am working on the project almost everyday, but I do get distracted from everything else going on in my house. I have revised my website schedule to give myself more time on the 2000 word deadlines, and less on making the website look pretty, as I find myself making it look good when I am supposed to be writing. 

I have only worked on my Tableau tool so far on my project. I used the tool to compare the number of reported cases of child abuse in New Jersey to the number of reported cases in the
United States. After playing with Tableau and Google Sheets for a while, I was able to create a pie chart showing the two values. Although I was hoping for more of a statistical chart, I do think the pie chart works. I copied the embed code from the Tableau website into my project but the graphic does not come up properly. I can see the image but it shows a triangle, almost like a “play” button and does not allow me to scroll over the image to see the statistics and number values. Additionally, I have not put too much effort into finding images for my website yet, but I do think a sad image on my homepage would grasp the reader’s attention and make a point that this is a serious social issue. 

Despite minor obstacles and time rescheduling, I think my website is going somewhat smoothly. I have copied some of my writing into the actual WordPress website, but I am still writing more on my google document, which has helped me keep track of my sections and word count.

css.php