
Name: Cathy Moran Hajo (Ramapo College of NJ)
Discipline: History
Course(s)/Semesters Taught: Social Science Inquiry (Honors) (Spring 2020)
DH Tools to be Used: Tableau, Google Forms.
For my Honors Social Science Inquiry course I wanted students to experience social science survey design, collection, and interpretation. In the first weeks of the semester, we read and discussed the ways that social scientists gather and use data. The class survey was to determine what social issues people feel are most important.
Students worked in small groups to brainstorm –what kinds of questions would they ask, how would they structure the format of responses, what kinds of demographics did they want to gather? Each group presented their ideas and then as a class we narrowed it down and created one survey.
- Students decided that they wanted to survey college students only, but did not want to limit it to Ramapo College students.
- They used a combination of open and closed answer questions.
- We decided to offer a $25 Visa Gift Card to one lucky winner
- They created the survey using Google Forms
There were a few setbacks/lessons learned.
- Our survey was open during mid-February and mid-March, just as most of the schools closed down. We only got 72 responses.
- Group editing the Google Form was a bit chaotic and somehow they deleted their question on the respondent’s race.
- Debate over whether to use 3 categories (Most Important, Somewhat Important, or Not Important) vs. 5 categories (Highly, Important, Somewhat, Slightly, Not) was made because they thought that most people would view on their phones and it was hard to scroll through the choices. After seeing the results they wished they had more differentiation.
- A global pandemic was not one of the social issues we suggested.
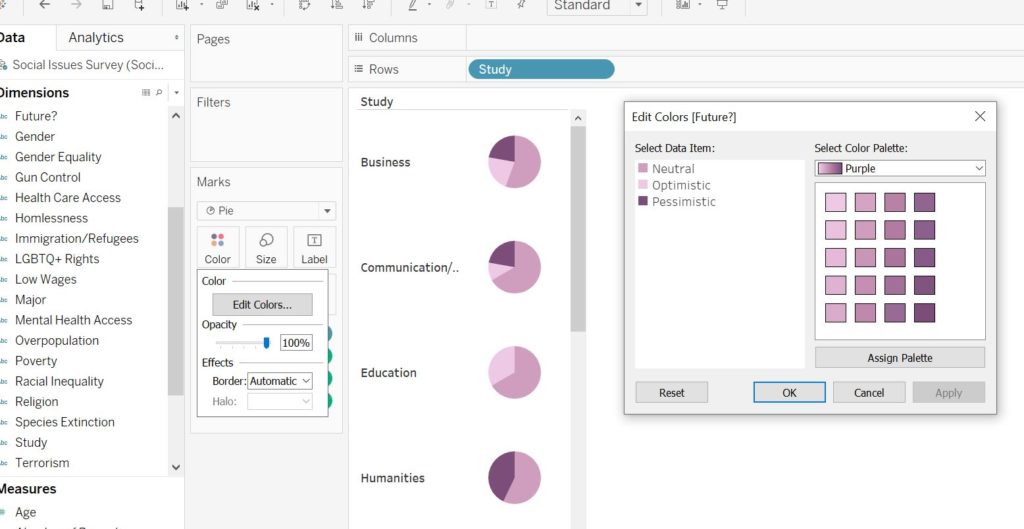
We were able to obtain basic data from analyzing the Google Forms responses. We exported the data into a Google Sheet and then each student made a copy, , cleaned the data, and imported it into Tableau Public for more detailed analysis.
- Some students looked at one social issue (often the one they were working on for their website) and explored how demographics (gender, class year, major, and school impacted responses.
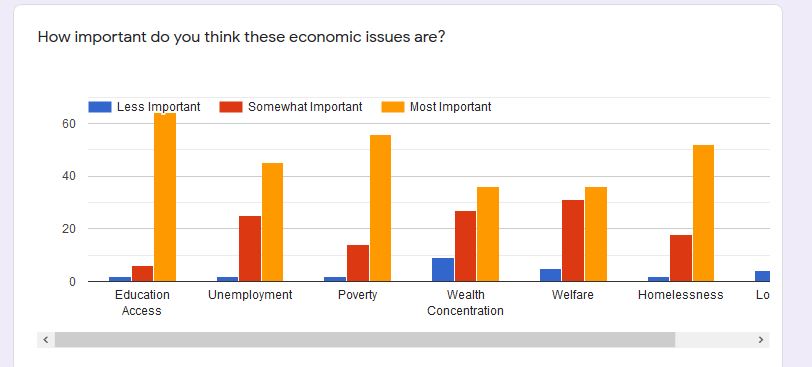
- Others looked at one major and how they felt about several issues.
- We asked a general question about how people saw the future and some students analyzed those results.
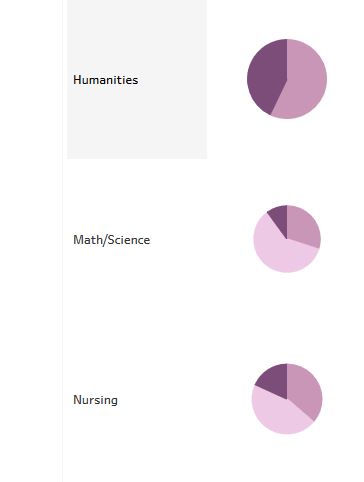
Each student created two visualizations and wrote a brief paragraph exploring what they thought the data showed and how they found the visualization process. This helped them get up to speed on using Tableau for their website projects using data on a social issue that they found or created.